The histogram; truth or dare?
/Are you using the histogram when you are out taking photographs? And if you are, do you understand what it's telling you or have you fallen under the spells and myth’s and mis-conceptions about the histogram and its use?
In this article I will explain what a histogram is, some of its myth's and mis-conceptions, as well as provide you with real-world examples of histograms. It is also a great way for you to learn how to use the histogram properly.
What is a histogram
A histogram is a graphical representation of measured values plotted along two axis. In digital photography a histogram is a graphical representation of a digital image’s tonal range. The horizontal axis represents the tonal range from the darkest tone (0), to the brightest tone (255), while the vertical axis represents how many pixels of the image are in each given tonal range. In other words, a graphical representation of each pixels brightness (tonal range), of the given image.
In photography tone is the effect light has on colour, less light produces darker more saturated colours while more light produces lighter less saturated colours while colours in the mid-tone range will be perceived more or less as normal.
Depending on camera and editing software you use, you may come across histograms that are divided into three zones (Darks-Midtones-Brights), or five zones (Blacks-Shadows-Midtones-Highlights-Whites), or none at all. While these division’s do not have any effect on the actual information the histogram shows us, it makes it easier for us to tell what tonal range our image is in and, give us greater control when developing our photos in the digital darkroom.
So what does a histogram look like? Below are three examples using the three zone system.
Now that we have gotten an overview of what a histogram is let us have a deeper look at it by using the five zone system.
Blacks
Blacks are found to the far left of the histogram right next to the shadows. This tonal range represents the darkest parts of an image to pure black and is normally used to set an image's black point. Think of the night-sky, deep shadows or a completely black background.
Blacks tonal range.
Shadows
The shadows tonal range is found to the left of the mid-tones and affects the lighter dark areas of an image, such as, hang onto your hats, the shadows of a photograph as well as other tones within the same range. Think of shadows on someone’s face or the shadow on the ground under a tree.
Shadows tonal range.
Mid-tones
The mid-tones are found in the middle of the histogram and makes up the largest portion of the histogram. Here medium grey tones are represented as well as their colour counterparts in an image. Think of someone’s skin tones or a landscape vista in afternoon light.
Mid-tonal range,
Highlights
Highlights are found to the right hand-side of the histogram’s mid-tones, these represent the brighter parts of a photo that aren’t pure white. Think of clouds or brightly colours cloths and reflections created by the sun.
Highlights tonal range.
Whites
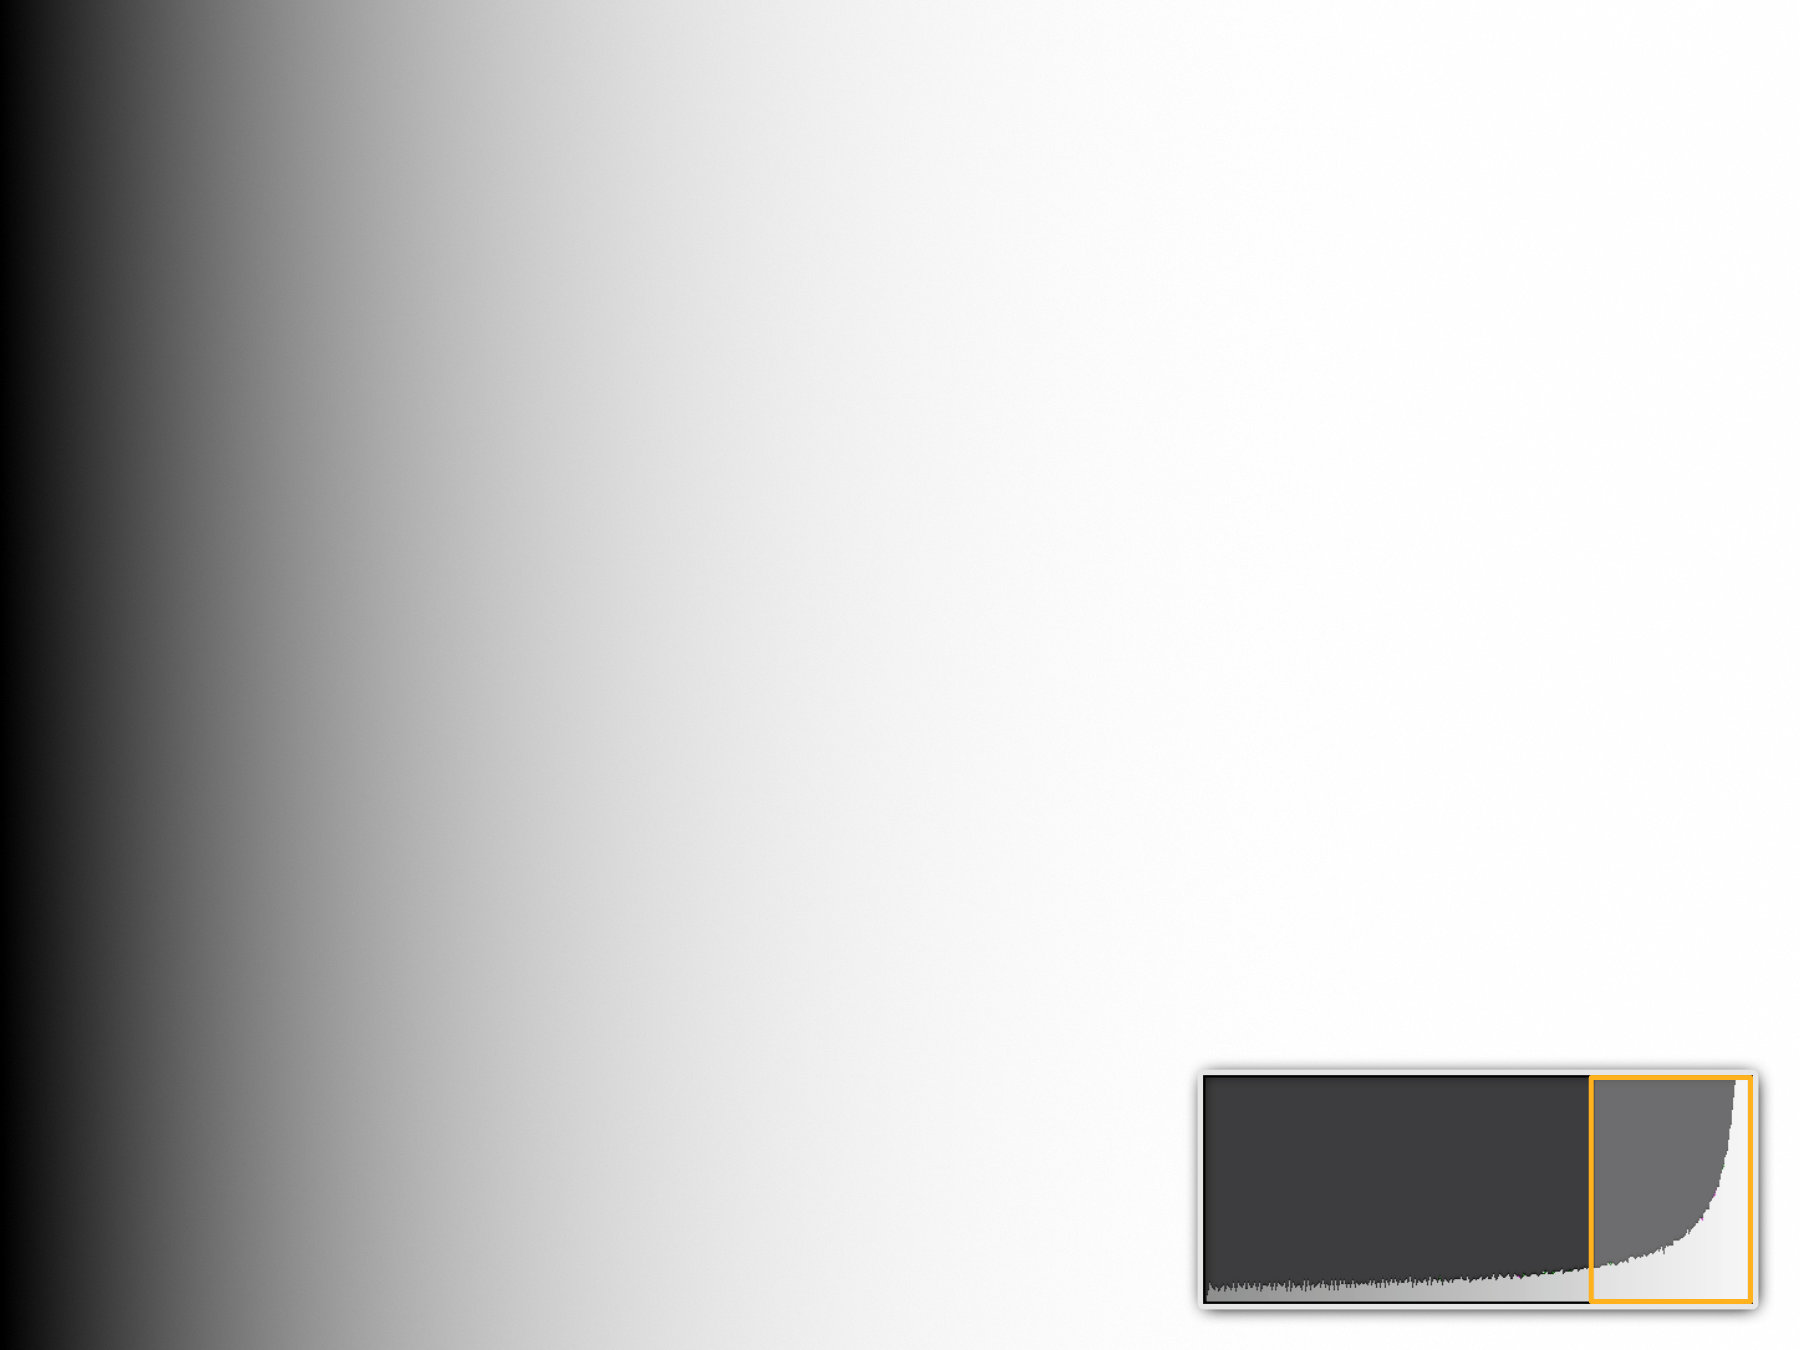
Found to the far right of the histogram next to the highlights, these represent he areas of extreme brightness to pure white and is used for settings an image's white point as well as help with highlight recovery. Think of a completely white background or the reflection of the sun on polished chrome.
Whites tonal range.
Clipping
Clipping occurs when areas of an image falls outside the dynamic range the camera is capable of recording, meaning we have no detail in those areas of the image and it will render either completely black or completely white. We call this clipping. It happens only in areas of extreme darkness or brightness such as very dark shadows, dark cloths or the night sky or very bright midday sky, white cloths or reflections. You can tell if you clip either the shadows or the highlights when the histogram is pressed up against either side of its edges.
When shooting in RAW you can recover details from clipped areas as long as they are within a stop or two, however if you shoot in JPEG that information is lost and you won’t be able to recover any details from the clipped areas.
So what does clipping look like? In Lightroom’s develop module you can enable shadow and highlight clipping warning by clicking the respective icons on the upper left corner (shadow clipping), or upper right corner (highlight clipping), of the histogram. Lightroom will then show clipped areas in blue (shadow clipping) and red (highlight clipping), which you then can attempt to recover using the appropriate sliders. The clipping icon will turn the colour of an individual channel that is being clipped, i.e. red, green, blue, magenta, cyan, yellow etc and white when all detail is blown-out.
Lightroom shadow (blue) and highlight (red) clipping.
You can even see this while out in the field shooting using the highlight warning aka ‘blinkies’ on the back of your camera. This will cause your camera to warn you that you have clipped the highlights by blinking the areas in the image on and off that have been clipped and you can adjust your exposure accordingly.
In-camera highlight clipping.
Myth's and mis-conceptions
Now that you know what a histogram is let’s looks at some myth's and mis-conceptions surrounding it so you don’t fall into their trap.
One perfect histogram
Some photographers live by the notion that a photograph needs to have a certain histogram shape to it, otherwise it is not a good photograph. They will tell you that the histogram should peak in the mid-tones and taper off towards both edges.
This is simply not true, there is no such thing as a, one-size-fits-all histogram. If you are shooting a dark scene, most of your tones will be pushed to the dark areas and vice versa. That being said if you have a scene with many mid-tones in it, like a landscape, and you want to faithfully represent that, you can expect the histogram to show more mid-tone pixels.
Analog film does not have a histogram and photographers got on fine without it for centuries, so why in the digital age is there all of the sudden a need for a perfect histogram?
It shows the correct exposure
Similar to the earlier point, there is a notion that the histogram shows you if you have exposed your photo correctly or not, again claiming to have a balanced exposure with most pixels in the mid-tones.
Again this is also not true. Look at the scene you are shooting, if it is a dark moody scene most of your pixels will be in the dark tonal range with very little to no mid-tones and brights depending on the scene. Further the histogram as we now know, only shows you what already is in the digital file, whether it is accurate, over or under exposed you won’t be able to say just by looking at the histogram.
With today’s cameras you are much better off looking at the actual image preview on the back of your camera to judge whether or not what you are seeing is ‘accurate’.
The only way to get a 100% accurate exposure is by using a light meter.
RAW camera histogram
When shooting in RAW, the image you see on the back of your camera is a camera processed JPEG preview that is embedded in the RAW file, thus the histogram you see is that of the JPEG preview, not the actual RAW file. Therefore even though the JPEG preview says you have clipped highlights or shadows, you may still not have clipped them in the RAW version.
You have clipped the {channel}
I hear this one all the time, from instructors to self-taught enthusiast where they act as clipping a single RGB channel is the end of the world, when in-fact, it is not. When we clip one of the RGB channels or all of them for that matter, look at the scene in-front of you and the image preview on the back of your camera then make a judgment call. Ask yourself if what you are clipping is pertinent to the scene.
If not, or if you are deliberately blowing out the highlight or shadows, there is no reason to adjust the exposure, but if you’ve blow out something important, then adjust the exposure accordingly in-camera or during development.
Expose to the right (ETTR)
This term comes from pushing the histogram as far to the right as possible without clipping any highlights in order to bring out as much tonal range in the shadow details as possible, minimising noise and maximising information recorded to the file for post-process development. While it has it’s uses as described it can also completely ruin your shot if done incorrectly and, it doesn’t mean you should always do it just because you can.
So here’s another idea; why not just expose correctly for the scene directly in-camera instead, since when you develop your photo you will reduce the brights and darks anyway, ending up with a very similar, if not the same result.
I do use either this technique or bracketed exposures when I know I need to bring out deep shadow detail during development I cannot get with a correct exposure in order to reduce noise.
Real-world histogram examples
Now that we know a little bit more of the myths and mis-conception surrounding the histogram let’s have a look at some real-world examples of images and their histograms and you be the judge if they are wrong for the intent of the scene in-front of you.
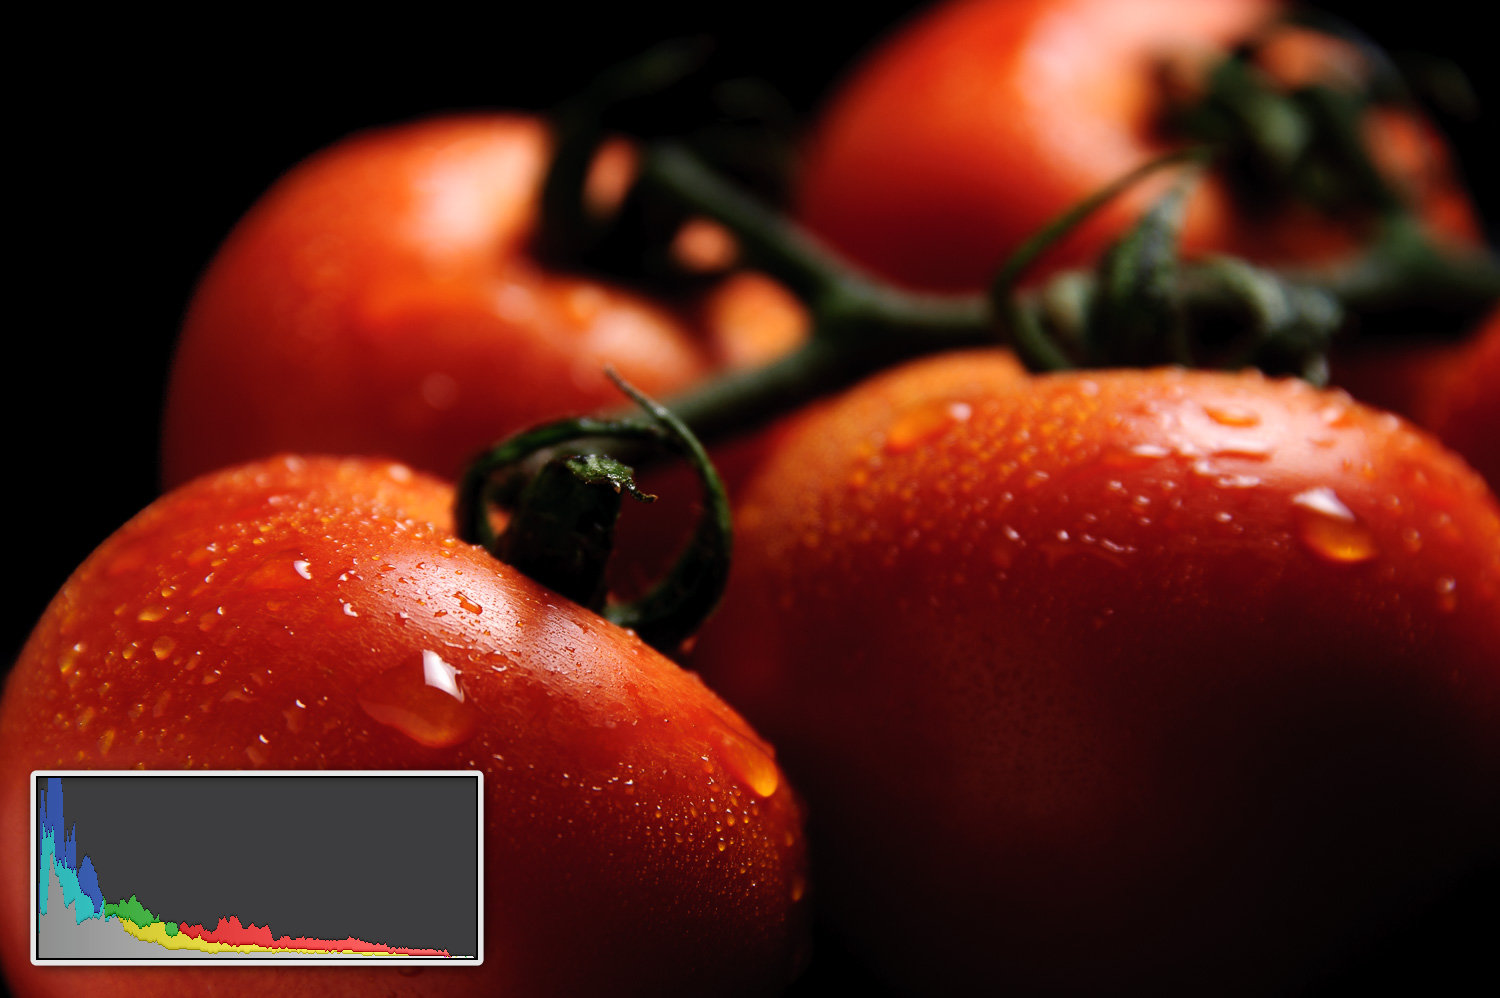
Low-Key
Low-key photography is the art of using deep blacks and low light to produce a darker moodier tone of the image. I personally love low-key photography and it can transform aconventional scene into something extraordinary and mysterious, not to mention the way light plays on the subjects.
High-Key
High-key photography is the exact opposite of low-key photography, here we aim at producing as much bright tones as possible to sometimes even deliberately blowing out the highlights. This is popular in product photography.
Balanced exposure (mid-tone)
This is were most photography will end up where the histogram is somewhat evenly spread out across the histogram. This is exemplary to landscape, city & architecture etc where the photographer aims to reproduce a scene the way we perceive it with our own eyes.
The takeaway
As we could see in the examples, histograms will wary widely from scene-to-scene, even the same scene as with the coffee grinder examples. While the histogram is a valuable tool it should be used exactly like that, a tool to help you judge the scene in-front of you. So don’t let the histogram dictate the way you shoot nor should you let someone tell you that because your histogram doesn’t look a certain way it automatically makes your photo bad or unusable.
When people look at your photo’s they don’t see the histogram, they will either like or not like your work based on the photo itself, not on the histogram.
I use the histogram mostly when developing my photos in Lightroom and on bright sunny days, as an aid to ‘see’ the tonal range of the image, mostly because my camera is older the display doesn’t perform well in those conditions. The one time I always use and rely upon the histogram is when shooting night photography. This is really the only way to determine if you have sky detail to get a good exposure.
Thanks for reading and please help spread the word by sharing this article.
Until next time, keep shooting away and trust in your eyes!


